MONTREAL, 5 August 2020: The International Air Transport Association released on Tuesday its World Air Transport Statistics (WATS) publication with performance figures for 2020 that illustrated the devastating impact of the Covid-19 crisis on global air transport.
The daily news feeds on the state of the airline business had already prepared us for the worst-case scenario. 2020 goes down as the worst year on record for the world’s airlines.

IATA’s latest report spells out the grim details:
- 1.8 billion passengers flew in 2020, a decrease of 60.2% compared to the 4.5 billion who flew in 2019
- Industry-wide air travel demand (measured in revenue passenger-kilometres, or RPKs) dropped by 65.9% year-on-year
- International passenger demand (RPKs) decreased by 75.6% compared to the year prior
- Domestic air passenger demand (RPKs) dropped by 48.8% compared to 2019
- Air connectivity declined by more than half in 2020, with the number of routes connecting airports falling dramatically at the outset of the crisis and was down more than 60% year-on-year in April 2020
- Total industry passenger revenues fell by 69% to $189 billion in 2020, and net losses were $126.4 billion in total
- The decline in air passengers transported in 2020 was the largest recorded since global RPKs started being tracked around 1950
“2020 was a year that we’d all like to forget. But analyzing the performance statistics for the year reveals an amazing story of perseverance. At the depth of the crisis in April 2020, 66% of the world’s commercial air transport fleet was grounded as governments closed borders or imposed strict quarantines. A million jobs disappeared. And industry losses for the year totalled USD126 billion. Many governments recognized aviation’s critical contributions and provided financial lifelines and other forms of support. But it was the rapid actions by airlines and the commitment of our people that saw the airline industry through the most difficult year in its history,” said IATA’s director-general Willie Walsh.
Key 2020 airline performance figures from WATS:
Passengers
- Systemwide, airlines carried 1.8 billion passengers on scheduled services, a decrease of 60.2% over 2019
- On average, there was a $71.7 loss incurred per passenger in 2020, corresponding to net losses of $126.4 billion in total
- Measured in ASKs (available seat kilometres), global airline capacity plummeted by 56.7%, with international capacity being hit the hardest with a reduction of 68.3%
- Systemwide passenger load factor dropped to 65.1% in 2020, compared to 82.5% the year prior
- The Middle East region suffered the largest proportion of loss for passenger traffic* with a drop of 71.5% in RPKs versus 2019, followed by Europe (-69.7%) and the Africa region (-68.5%)
- China became the largest domestic market in 2020 for the first time on record, as air travel rebounded faster in their domestic market following their efforts to control COVID-19
The regional rankings (based on total passengers carried on scheduled services by airlines registered in that region) are:
- Asia-Pacific: 780.7 million passengers, a decrease of 53.4% compared to the region’s passengers in 2019
- North America: 401.7 million passengers, down 60.8% over 2019
- Europe: 389.9 million passengers, down 67.4% over 2019
- Latin America: 123.6 million passengers, down 60.6% over 2019
- Middle East: 76.8 million passengers, a decrease of 67.6% over 2019
- Africa: 34.3 million passengers, down 65.7% over 2019
- The top five airlines ranked by total scheduled passenger-kilometres flown were:
| 1 | American Airlines | (124 billion) |
| 2 | China Southern Airlines | (110.7 billion) |
| 3 | Delta Air Lines | (106.5 billion) |
| 4 | United Airlines | (100.2 billion) |
| 5 | China Eastern Airlines | (88.7 billion) |
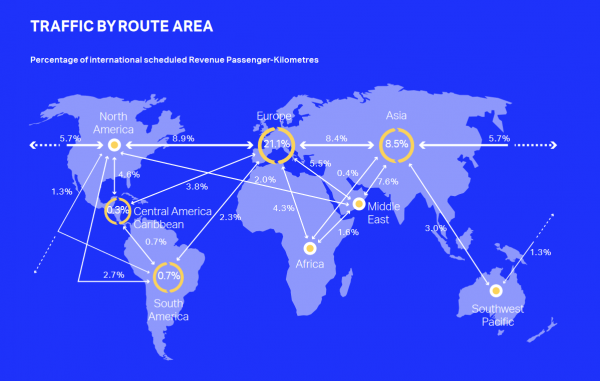
- The top five route areas** by passenger demand (RPKs), with the largest drop being seen in routes within the Far East:
| 1 | Within Europe | (290.3 million, down 70.7% from 2019) |
| 2 | Europe – North America | (122.9 million, decreased 80.4% from 2019) |
| 3 | Within the Far East | (117.3 million, a decrease of 84.1% from 2019) |
| 4 | Europe – Far East | (115.3 million, a decrease of 79% from 2019) |
| 5 | Middle East – Far East | (104 million, down 73.6% from 2019) |
- The top five domestic passenger airport-pairs were all in Asia and outperformed top international routes as domestic recovery returned faster, particularly in China:
| 1 | Jeju – Seoul Gimpo | (10.2 million, up 35.1% over 2019) |
| 2 | Hanoi – Ho Chi Minh City | (5.9 million, an increase of 54.3% from 2019) |
| 3 | Shanghai-Hongqiao – Shenzhen | (3.7 million, up 43.4% from 2019) |
| 4 | Beijing-Capital – Shanghai-Hongqiao | (3.6 million, increased by 11.8% from 2019) |
| 5 | Guangzhou – Shanghai-Hongqiao | (3.5 million, up 41.2% from 2019) |
- The top five nationalities*** travelling by air (international) were:
| 1 | United States | (45.7 million, or 9.7% of all passengers) |
| 2 | United Kingdom | (40.8 million, or 8.6% of all passengers) |
| 3 | Germany | (30.8 million, or 6.5% of all passengers) |
| 4 | France | (23.3 million, or 4.9% of all passengers) |
| 5 | India | (17.4 million, or 3.7% of all passengers) |
A preview of the World Air Transport Statistics can be downloaded here. You can also purchase the complete set of WATS statistics which includes further figures and analysis.


