
SINGAPORE, 2 August 2024: The International Air Transport Association (IATA) released data for June 2024, highlighting an increase of 12.3% in international passenger uplift compared with the same month in 2023.
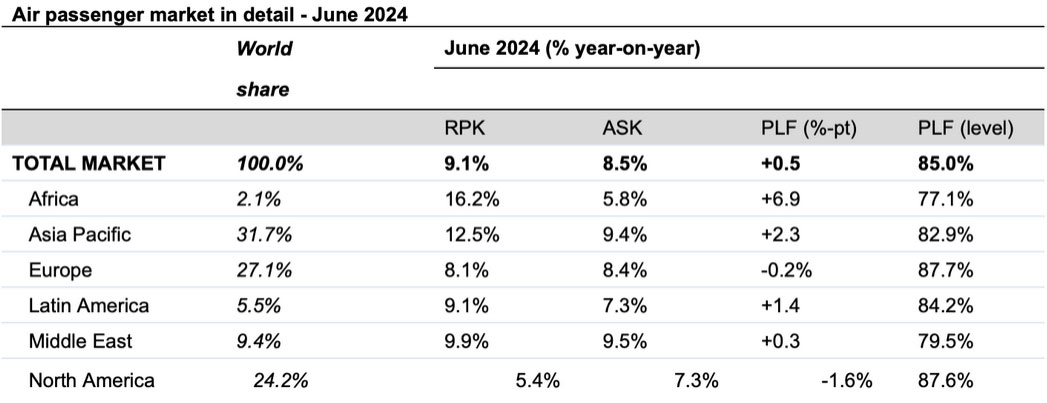
Total demand, measured in revenue passenger kilometres (RPK), was up 9.1% compared to June 2023. Total capacity, measured in available seat kilometres (ASK), was up 8.5% year-on-year. The June load factor was 85.0% (+0.5 percentage points (ppt) compared to June 2023).
International demand rose 12.3% compared to June 2023. Capacity was up 12.7% year-on-year, and the load factor improved to 85.0% (-0.3ppt on June 2023).
Domestic demand rose 4.3% compared to June 2023; capacity was up 2.1% year-on-year, and the load factor was 85.0% (+1.7ppt compared to June 2023).
“Demand grew across all regions as the peak northern summer travel season began in June. With overall capacity growth lagging in demand, we saw a very strong average load factor of 85% achieved in both domestic and international operations. Operating with such high load factors is both good and challenging. It makes it even more important for all the stakeholders to operate with equal levels of efficiency to minimise delays and get travellers to their destinations on schedule,” said IATA’s Director General Willie Walsh
“As the Olympic Games unfold in Paris, the aviation industry is proud of its continuing role in supporting the Olympic story by bringing many of the athletes, fans, and officials together. It is a great reminder of how aviation transforms our vast world into a global community. We wish France every success as the host of the games and cheer all the athletes who will demonstrate the best of human endeavour over the next weeks,” said Walsh.
Regional Breakdown – International Passenger Markets
All regions showed strong growth for international passenger markets in June 2024 compared to June 2023.
Asia-Pacific airlines’ growth remained strong, with a 22.6% year-on-year increase in demand. Capacity increased 22.9% year-on-year, and the load factor was 83.0% (-0.2ppt compared to June 2023). The Africa-Asia route was the fastest expanding regional pair, growing 38.1%.
European carriers saw a 9.1% year-on-year increase in demand. Capacity increased 9.8% year-on-year, and the load factor was 87.4% (-0.6ppt compared to June 2023).
Middle Eastern airlines saw a 9.6% year-on-year increase in demand. Capacity increased 9.4% year-on-year, and the load factor was 79.7% (+0.1ppt compared to June 2023).
North American carriers saw a 6.6% year-on-year increase in demand. Capacity increased 8.6% year-on-year, and the load factor was 88.7% (-1.6 ppt compared to June 2023), the highest among regions.
Latin American airlines saw a 15.3% year-on-year increase in demand. Capacity climbed 15.6% year-on-year. The load factor was 85.1% (-0.2ppt compared to June 2023).
African airlines saw a 16.9% year-on-year increase in demand. Capacity was up 5.8% year-on-year. The load factor rose to 77.0% (+7.4ppt compared to June 2023), the largest improvement among all regions.


