


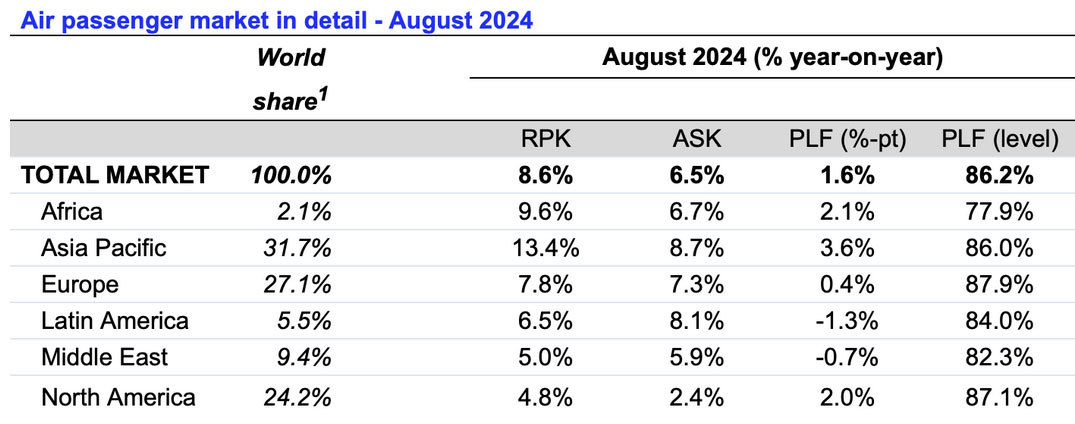
SINGAPORE, 7 October 2024: The International Air Transport Association (IATA) released data for August 2024 global passenger traffic that saw demand, measured in revenue passenger kilometres (RPK), improve by 8.6% compared to August 2023
Total capacity, measured in available seat kilometres (ASK), was up 6.5% year-on-year. The August load factor was 86.2% (+1.6ppt compared to August 2023), a new record high.
International demand rose 10.6% compared to August 2023. Capacity was up 10.1% year-on-year, and the load factor rose to 85.7% (+0.4ppt compared to August 2023).
Domestic demand rose 5.6% compared to August 2023. Capacity was up 1.2% year-on-year, and the load factor was 86.9% (+3.6ppt compared to August 2023).
“The market for air travel is hot, and airlines are doing a great job at meeting the growing travel demand. Efficiency gains have driven load factors to record highs. At the same time, the 6.5% capacity increase demonstrates resilience in the face of persistent supply chain issues and infrastructure deficiencies,” said IATA’s Director General Willie Walsh
“Looking ahead, the continued strong demand growth signals that we could be fast approaching an infrastructure capacity crunch that would restrict connectivity and choice for passengers and businesses. If governments want to maximise the benefits of aviation, they must take bold decisions to ensure sufficient infrastructure capacity. In the interim, airports and air navigation service providers must use their current resources more. In particular, the variance in the declared capacity of airports with broadly the same infrastructure needs to be resolved, with airports emulating the best performers. The industry cannot afford to under-utilise our airport infrastructure,” said Walsh.
Regional Breakdown – International Passenger Markets
All regions showed growth for international passenger markets in August 2024 compared to August 2023. Ticket sales in May-July for travel in August-September showed a 6.6% year-on-year increase, which bodes well for further strong growth this year.
Asia-Pacific airlines achieved a 19.9% year-on-year increase in demand. Capacity increased 18.8% year-on-year and the load factor was 85.2% (+0.8ppt compared to August 2023). Asia-Pacific is still thriving and is now just eight percentage points from full recovery to pre-pandemic volumes.
European carriers saw a 9.1% year-on-year increase in demand. Capacity increased 8.5% year-on-year, and the load factor was 87.2% (+0.5ppt compared to August 2023). The Europe-Asia route was by far the fastest-growing but is still markedly below its 2019 peak.
Middle Eastern carriers saw a 4.9% year-on-year increase in demand. Capacity increased 5.6% year-on-year, and the load factor was 82.5% (-0.6ppt compared to August 2023).
North American carriers saw a 4.3% year-on-year increase in demand. Capacity increased 3.8% year-on-year, and the load factor was 88.2% (+0.4 ppt compared to August 2023), the highest among regions.
Latin American airlines saw a 13.6% year-on-year increase in demand, 15.2% increase in capacity, and an 85.1% load factor (-1.2ppt compared to August 2023).
African airlines saw a 10.1% year-on-year increase in demand. Capacity was up 7.3% year-on-year. The load factor rose to 77.8% (+2.0ppt compared to August 2023).


